Learning Advection Diffusion Universal Differential Equation (UDE) for Control
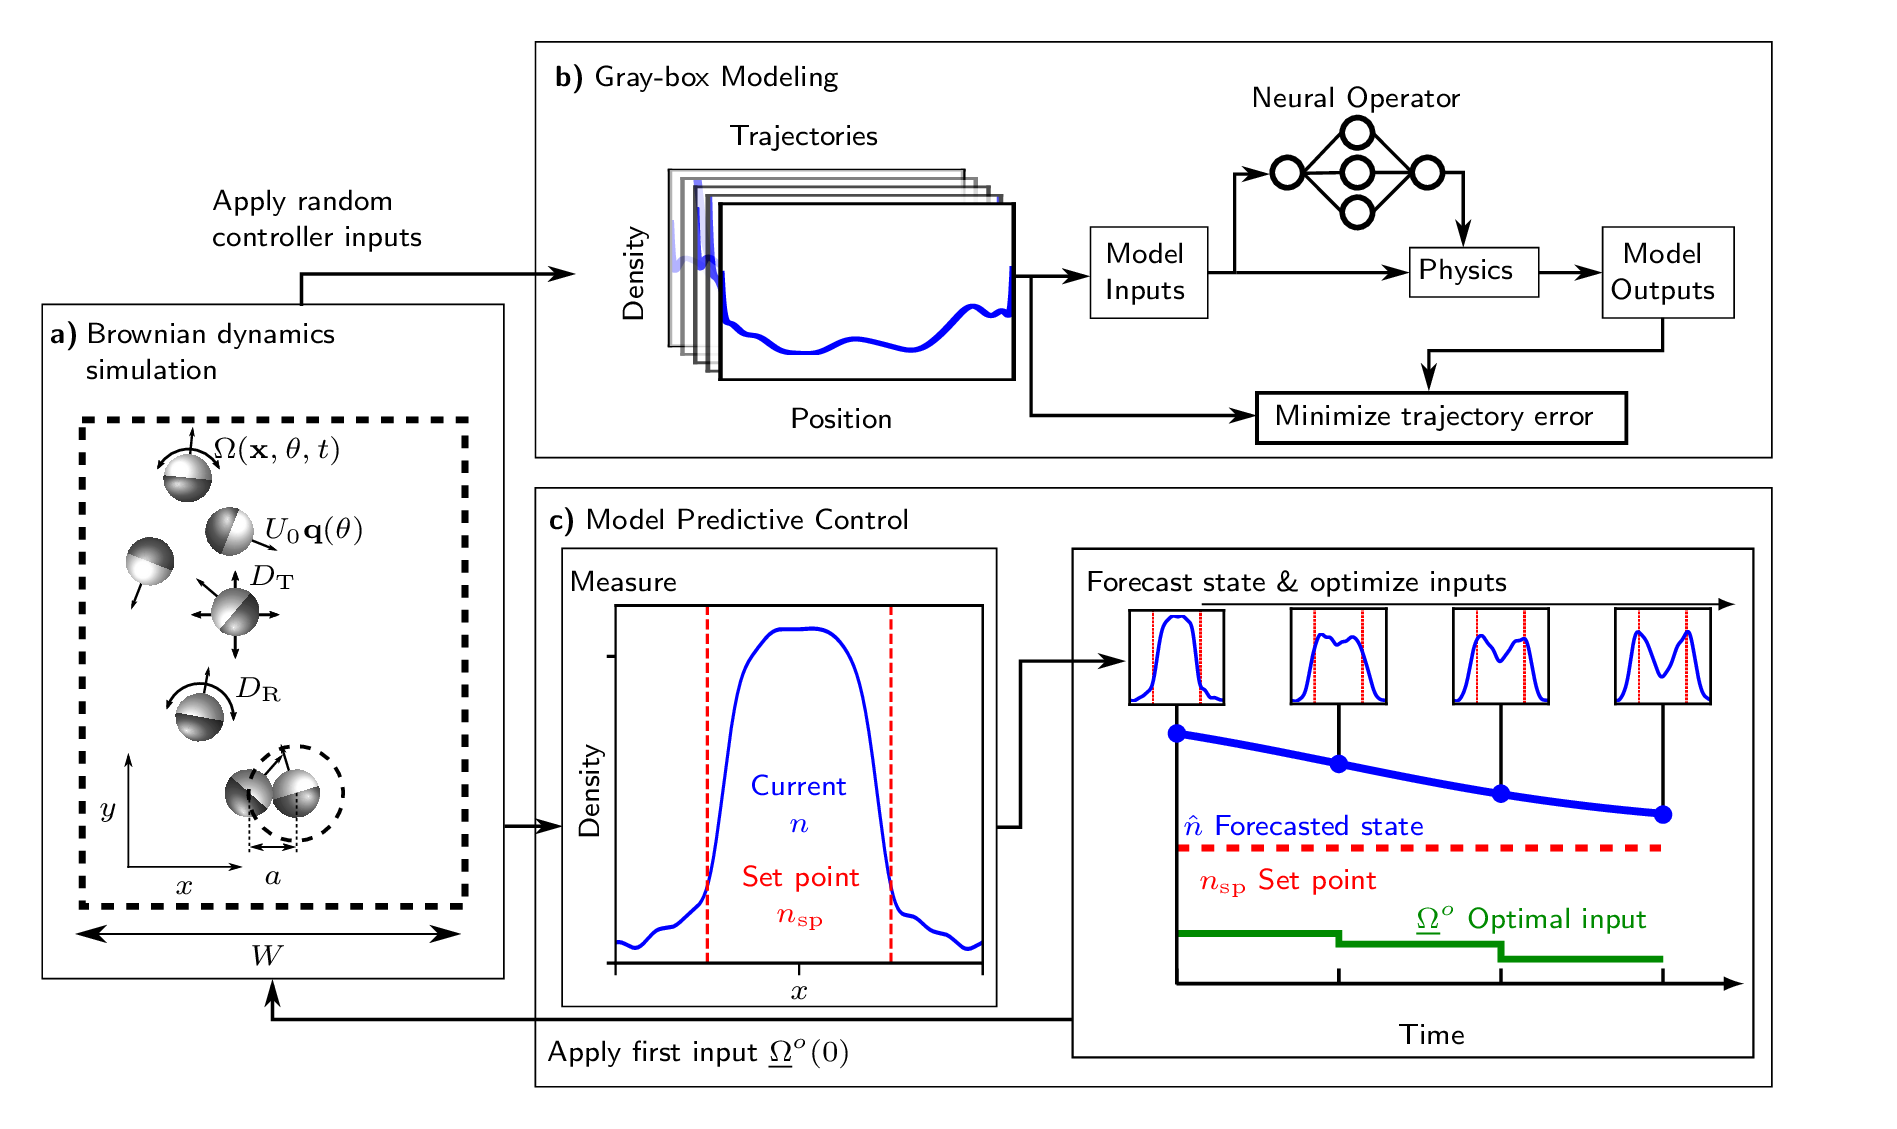
Scientific machine learning framework for modeling and control of interacting active matter. (a) Flow chart of the proposed framework. We use agent-based simulations to learn closures within a continuum-level universal differential equation (UDE). This UDE is then embedded into Model Predictive Control (MPC) to enable precise control over the agent-based simulation, guiding it towards desired behaviors. (b) Schematic of 2D interacting active Brownian particles (ABPs) under an actuated aligning external field that orients particles left or right. % More generally, our framework may be applied to systems where the particle density is observable, including microscopy images of controllable active particles. (c) The UDE is formulated as an advection-diffusion equation. A neural operator represents the effective velocity field, learning its dependence on particle number density n, external field Ω, and past densities and fields p. The UDE is simulated with a differentiable solver under random external field sequences, starting from an initial density field. By comparing predicted density trajectories to those from agent-based simulations, we learn the advection term, providing closure relations for microscopic effects such as self-propulsion, interactions, and external field responses. Only macroscopic density fields, estimated from agent-based simulations, are used for training; individual particle trajectories are not directly used. (d) The learned UDE is embedded into MPC, enabling us to control emergent behaviors of the active matter system. MPC optimizes the external field sequence to achieve a desired goal, such as splitting the particle population into distinct groups or dynamically controlling particle fluxes. Our framework is robust, capable of handling particle interactions, and optimizes control actions for precise and adaptive manipulation of active matter.
UDE-MPC for interacting ABPs
System: Magnetic-like actuator on Active Brownian Particles
The particles in the BD simulation (left) are colored by their orientation as indicated by the legend. The number density (middle) corresponds to the BD simulation. The input torque (right) is the control signal for the magnetic-like actuator and starts with a step that orients particles to the center, then negative to orient particles to the left, and finally positive orient particles to the right. There are periodic boundary conditions at the walls.
Training trajectory
Training trajectory for active hard disks with Peclet number=100, volume fraction of 40% and no confinement. Random orienting fields (right) are applied to the BD simulation (left). The number density trajectory (second from left) corresponds to the BD simulation and is used to train the advection diffusion UDE.
Testing trajectory
Prediction accuracy of the advection diffusion UDE model over a 100 τR time horizon using testing data. (a) The L2 norm of the error between the predicted and measured number densities remains below 0.01 throughout the simulation, indicating a close match to the true number density profile. X-marks indicate points where the actuator field changes. (b) Snapshots of the particle simulation are shown for six time points: t=[0τR, 20τR, 40τR, 60τR, 80τR, 99τR]. Particles are colored based on their polar order in the x direction, normalized by density, mx(x)/n(x), where mx(x) = ∫∫ cos(θ)P(x, θ, t),dθ,dy. Positive polar order (particles oriented to the right) is shown in purple, while negative polar order (particles oriented to the left) is shown in green. Regions without strong polar order are colored white. Colored arrows above the particles are included for visual clarity. (c) Snapshots of the number density field for both measured (blue) and predicted (red) values are shown for the same six time points as in (b). (d) The advective flux due to the velocity field vxn is displayed for measured (blue) and predicted (red) values, with fluctuations attributed to particle collisions. (e) The actuating field applied during the simulation is shown for context.
UDE-MPC to split and juggle population of active hard disks

Splitting and juggling the population of ABPs. The steps are as follows: (1) Split particles into two equal groups centered at x+ and x-; (2) Achieve a distribution where 30% of the particles are to the left of the origin while maintaining the populations centered at x+ and x-; (3) Repeat step 2 with 70% of the particles to the left of the origin; and (4) Return to step 1. (a) The sum of the mean squared distances (MSDs) of particles to their respective set points, x+ and x-, is plotted. (b) The target fraction of particles to the left of the origin (red line) and the realized fraction under Model Predictive Control (MPC) (blue line) are shown. (c) Particle simulation. Particles are colored based on their expected orientation in the x direction, averaged over the y direction: purple indicates particles oriented to the right, green indicates particles oriented to the left, and white indicates no strong orientation. Red dashed lines mark the set points x+ and x-. Colored arrows above the particles guide the eye. (d) Number density field. (e) Polar order field. (f) The actuating field applied to the system, extracted from the first input in the MPC sequence, is displayed.
Fastest trap problem for active hard disks
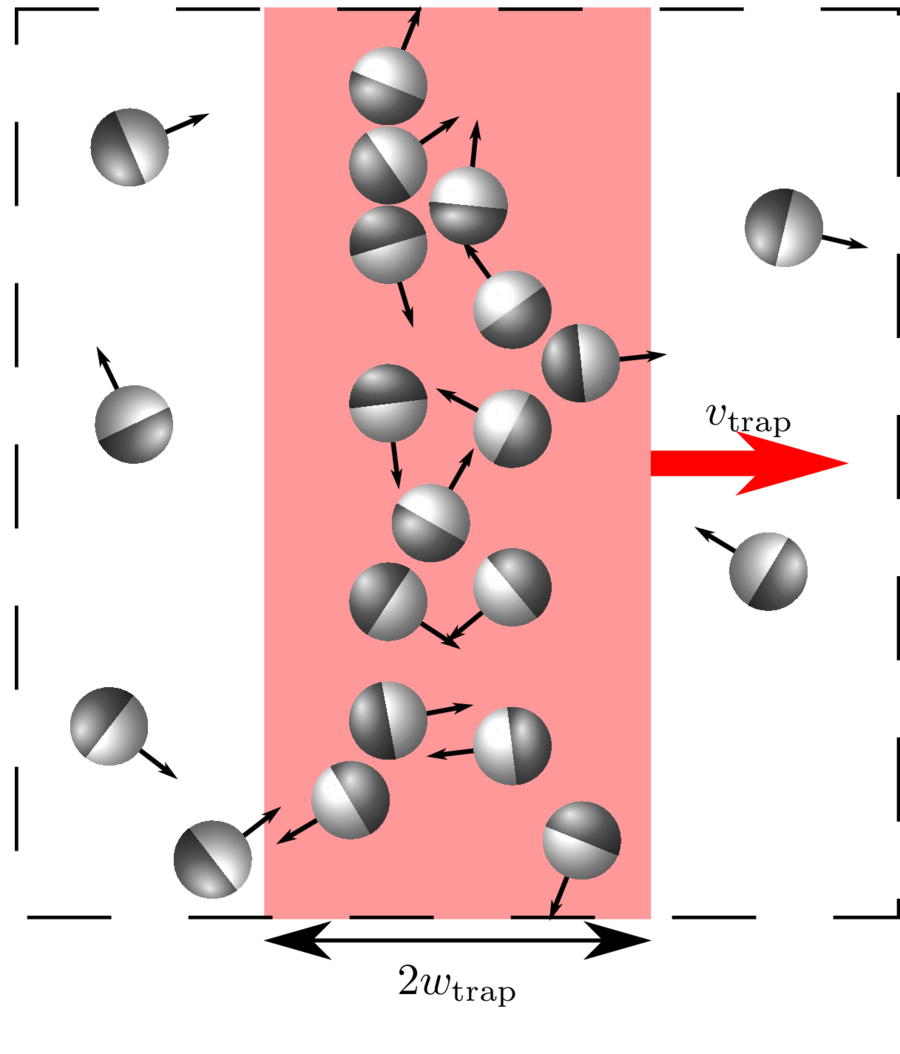
Illustration of the fastest trap problem for active hard disks. Particles within the red shaded region are considered trapped. The goal is to move the trap rightward as quickly as possible while maintaining a minimum trapped population.
UDE-MPC for the fastest trap problem
Fastest trap with nmin=0.6 and wtrap=4. (a) Trapped fraction ntrap(t) (blue) compared to the minimum fraction nmin (red dashed line). (b) Trap velocity vtrap over time. (c) Particle simulation snapshots with particles colored by expected orientation: green (left) and purple (right). The trap center is indicated by the red dashed line, and the trapped region is shaded in red. (d) Density field of the particles. (e) Polar order field showing the particle orientation. (f) Actuator field.
Advective flux control
Simultaneous control of particle number density and mean flux using UDE-MPC. (a) The set point mean flux (dashed red line) and measured flux (solid blue line) show accurate tracking throughout the sinusoidal profile. (b) Particle positions and polar order at representative times, highlighting leftward (green) and rightward (purple) orientations. (c) Density profiles consistently accumulate near x±, indicating the successful maintenance of the target accumulation. (d) Flux profiles confirm precise mean flux control, with measured mean flux (solid blue line) matching the set point (dashed red line). (e) Actuator field snapshots reveal dynamic control strategies, including field modulation to achieve target fluxes, paired with localized jamming around x± to maintain density accumulation about x±. Red dashed vertical lines indicate target particle accumulation points, emphasizing the controller's ability to simultaneously regulate both number density and flux across the domain.